Falling Leaves, Rising Trends: Navigating the Macroeconomic Landscape
Falling Leaves, Rising Trends: Navigating the Macroeconomic Landscape
Tim Savage PhD, Chief Economic Advisor

There is always the next recession. As the leaves turn red in New York City, the likelihood of an economic downturn in the next 12 months is receding rapidly. Moreover, absent further unforeseeable shocks such as war, it is increasingly likely that Jerome Powell and the Federal Reserve will have achieved a historic soft landing: reducing inflation to its two-percent target without arresting economic growth with its attendant higher unemployment. If so, it will require some introductory macroeconomics textbook may need, at a minimum, some new footnotes.
Analyzing Yield Curves
In my research bibliography, I have examined the yield curve as a signal of market perceptions regarding an impending recession. You may recall that the yield curve inverted in the fall of 2019, and I was comfortable telling my finance students that the U.S. would face recession-like conditions in 12 to 18 months. I made this prediction before the term 'COVID' entered the lexicon.
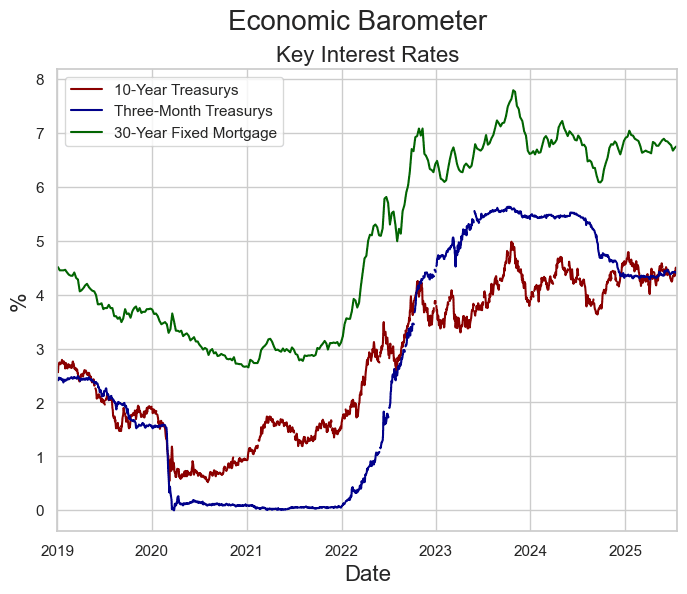
Given the interest rate tightening initiated by the Federal Reserve in 2022, the market reaction was swift. The graph below displays three key interest rates: three-month Treasuries (in blue), 10-year Treasuries (in red), and 30-year fixed mortgage rates (in green). As a result of aggressive policy tightening, the yield curve (red minus blue) inverted in Q3 2002, signaling the market's perception that the Fed was trying to engineer a recession to address inflation rates at 40-year highs.
The Recession Didn’t Materialize
As it became clear to market participants that the Fed was trying to engineer a soft landing, long-duration rates (green and red) continued to rise. In contrast. short-duration rates (blue) started to flatten. As a result, the yield curve, while still inverted, has approached -50 basis points (bps).
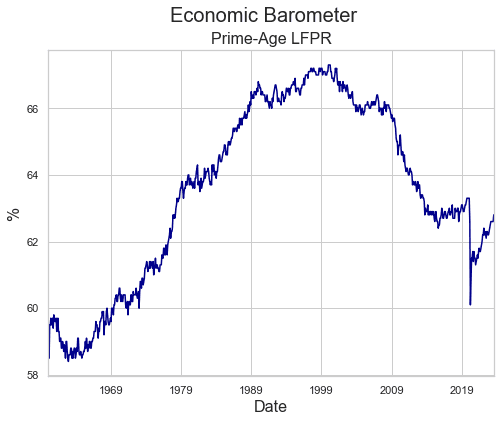
Furthermore, the U.S. job market remains robust with first-time unemployment insurance claims and unemployment rates at pre-pandemic levels. Moreover, and this is important for inflation, the graph below shows that the labor force participation rate among prime-age workers is nearing pre-pandemic levels.
Relevancy for SFR/BTR
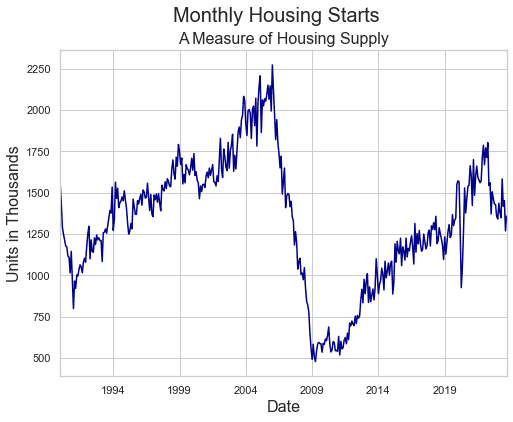
For the single-family rental market, it is important to track new-home construction. The graph below tracks this measure going back to the early 1990s. New-home construction peaked in about 2006, plummeted after the global financial crisis, and slowly recovered over the decade after 2009. Amid the pandemic, there was an initial drop of approximately 40% in new construction. However, as the housing market rebounded, investors engaged in building portfolios of single-family rental assets encountered heightened competition among buyers.
In response, the single-family rental sector has sustained growth through new construction initiatives. Builders are adopting innovative strategies to entice buyers, employing a variety of tools such as rate buy downs, closing cost assistance, and other incentives. Major home builders are leveraging their size and scale to effectively lower costs through partnerships and supply chain improvements.
The Takeaway
The economic landscape appears to be undergoing a notable shift as the likelihood of an imminent recession diminishes. Notably, the robust U.S. job market, with unemployment indicators at pre-pandemic levels, provides additional support for this positive economic outlook. In the realm of real estate, although many SFR and BTR players remain on the sideline, home builders are getting creative to optimize efficiency and attract buyers. Ultimately, the ability of our policymakers and market participants to adapt to unforeseen challenges, such as the impact of the pandemic, underscores the resilience of this economy.